
VaR vs CVaR: what the tail hides
Two trading books report the same one-day 99% value at risk: $2.33 million. A risk summary, written by a person or an AI assistant, would call them equally risky. One of them loses more than $4 million about once in 125 years. The other does it roughly once every 22 months.
Value at risk answers a narrow question: how large a loss we should not exceed on 99 days out of 100. It says nothing about how bad the hundredth day is. That gap matters more as AI tools start summarising risk reports, because a fluent summary tends to repeat the headline number and drop the caveat.
Two books, one VaR
Both books are synthetic. Each daily loss follows a simple distribution, so every number below can be reproduced exactly.
- Book A has normally distributed daily losses with a standard deviation of $1.00 million.
- Book B has fat-tailed losses: a Student-t distribution with 3 degrees of freedom, scaled so that its 99% VaR exactly matches Book A's.
| Measure (one day) | Book A: normal | Book B: fat-tailed |
|---|---|---|
| Standard deviation | $1.00m | $0.89m |
| VaR, 99% | $2.33m | $2.33m |
| Expected shortfall, 99% | $2.67m | $3.59m |
| VaR, 99.9% | $3.09m | $5.23m |
| Loss above $4m | about 1 day in 31,600 | about 1 day in 460 |
Read the table from the top. Book B looks calmer on volatility. It matches Book A on VaR. Only beyond the 99% line does the difference appear, and there it is large: on its worst 1% of days, Book B loses $3.59 million on average, 35% more than Book A.
At 252 trading days a year, a $4 million loss is roughly a once-in-125-years event for Book A and a once-in-22-months event for Book B.
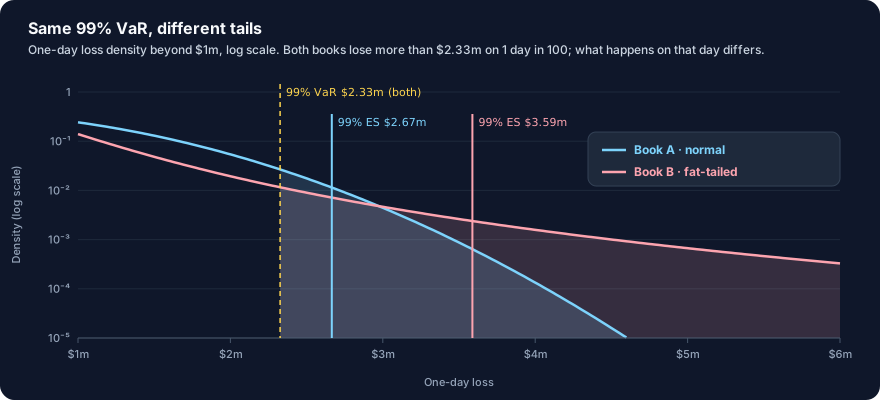
Expected shortfall looks past the line
Expected shortfall, also called conditional VaR or CVaR, asks the next question: when we do cross the VaR line, how much do we lose on average? It is the mean of the losses beyond the chosen percentile.
That makes it sensitive to exactly what VaR ignores. Two books can share a VaR while their tails differ, and expected shortfall will separate them.
Regulators made the same move. Under the Basel Committee's market-risk framework, banks using internal models calculate expected shortfall at a 97.5th percentile, one-tailed confidence level (MAR33.3), in place of the older 99% VaR.
The synthetic books show why the two levels are often compared. For normal Book A, 97.5% expected shortfall is $2.34 million, almost exactly its 99% VaR. For fat-tailed Book B it is $2.58 million, about 11% higher. When tails are thin, the change of measure moves little. When they are fat, it charges for them.
Change the tail, keep the VaR
Illustrative calculation. One synthetic book. Move the slider from a fat tail to a normal one; the book is rescaled each time so its 99% VaR stays at $2.33 million. Values are closed-form; nothing here calls a model.
- 99% VaR
- $2.33m
- 99% expected shortfall
- $3.59m
- 97.5% expected shortfall
- $2.58m
- 99.9% VaR
- $5.23m
- Standard deviation
- $0.89m
- Loss above $4m
- 1 day in 457
What to notice: VaR never moves. Expected shortfall, the 99.9% loss and the frequency of a $4 million day all move together, and volatility gives no warning: every fat-tailed setting has a lower standard deviation than the normal book.
Why this matters for AI in risk
Risk teams are starting to use language models to summarise daily risk packs, answer “what changed?” questions and draft commentary. Each of those can lose the tail.
Summaries keep the headline. A model asked to “summarise today's risk” will tend to lead with VaR because the report does. If expected shortfall is missing from the summary, the reader cannot tell Book A from Book B. A useful instruction, and a useful evaluation check, is that any risk summary reports both measures, their confidence levels and their horizon.
Explanations need the numbers behind them. “VaR is unchanged, so risk is unchanged” is a fluent sentence that the table above disproves. As in Evaluating AI assistants beyond an accuracy score, each claim in a generated explanation should trace to a figure in the report. A claim about risk being stable needs the tail measure as evidence, not the VaR line alone.
Models of the tail are still models. Expected shortfall is only as good as the loss distribution behind it. Historical simulation sees only the tail events in its window; a parametric model sees only the tail shape it assumes. An AI system that generates scenarios or fills data gaps can thin the tail without anyone noticing. Validation should compare tail measures, not just averages, before and after any AI component touches the data.
What to ask of a risk number
When a risk figure reaches a decision, generated or not, I would ask four things:
- Which measure, at which confidence level, over which horizon? “VaR” alone is not a number someone can check.
- What is the expected shortfall at the same level? If it is much larger than VaR, the tail is doing the work.
- Where does the tail come from? Historical window, assumed distribution, or simulation, and how many observations sit beyond the line.
- Does the commentary match the numbers? Every sentence about risk should point to a figure in the report.
VaR is a useful line. It is not a description of what lies beyond it.
All figures are synthetic, closed-form calculations for illustration. This is not risk-management or investment advice.
Further reading
- Basel Committee on Banking Supervision, MAR33: Internal models approach, capital requirements calculation, paragraph 33.3
- What MAS's AI guidelines ask of a markets business